2026 First Quarter CIO Letter: A Narrowing Path
Written by: Kasey Wopperer, Co-Founder and CIO of Stone Creek Advisors
April 6, 2026
Key Takeaways
Markets continue to price in a near-perfect outcome, including resilient growth, stable inflation, and no meaningful credit stress, despite emerging cracks beneath the surface.
Stress is beginning to emerge in private credit, where limited liquidity, rising borrowing costs, and opaque valuations may mask underlying risks until they are forced into the open.
The continued shift toward passive investing is distorting price discovery, concentrating capital in the largest companies, and increasing the potential for market dislocations.
Rising oil prices are adding pressure to consumers and inflation, tightening financial conditions without a corresponding policy response.
Gold is signaling a different reality, reflecting growing concerns around fiscal sustainability, currency debasement, and geopolitical risk.
The U.S. fiscal position continues to deteriorate, with rising debt and interest expense raising questions about long-term confidence in the dollar.
Slowing immigration and labor force growth increase reliance on productivity gains to sustain economic growth.
While each pressure may seem manageable in isolation, collectively they are narrowing the path forward and reducing the system’s margin for error.
Markets rarely break when things look obviously bad. They tend to crack when everything appears stable, until everything isn’t.
As we entered 2026, the narrative seemingly remained intact: resilient growth, easing inflation, and a Federal Reserve that may finally be done tightening. Equity markets, led by a narrow cohort, continued to reflect this optimism. Credit spreads remained tight and volatility sat near historical lows.
And yet, beneath that calm surface, pressure continued to build. The system likely carried more fragility than markets suggested. In Q1 further private credit stress came to light, GDP numbers for Q4 disappointed, and the conflict with Iran began. Now, as we close out Q1, some of those cracks are rising to the surface. Historically in these times, Treasury yields have fallen but today they are rising, further complicating the path to navigating economic or market weakness from here.
Why Are Treasury Yields Rising?
If you have read our CIO letters before, you are probably aware that we have been avoiding the long-end of the curve, above ten years, for a while now. Even in the 3-10 year part of the curve, we have been underweight and have been strategic in adding and trimming exposure from all parts of the Treasury curve.
There are two main reasons for this long-term underweight to the longer end of the curve.
We are concerned about the US fiscal position. If the economy continues to slow from here, tax revenues are likely to also slow and stimulus will be needed. This will further weaken the US fiscal position which is already on an unsustainable path. If buyers and holders of US Treasuries become concerned that the US cannot meet their debt obligations, yields on the long-end of the curve will spike. Historically in a recession, the long-end of the curve has rallied. We question if that will be the case this time around and we think that 7-10 years is likely to be enough of a recession hedge that we do not have to go further out.
Think of Treasuries as any other bond. It is a loan.
The price demanded to loan money is based on confidence in the institution that is borrowing.
As the creditworthiness of the borrower decreases, the buyer demands a better return for lending money.
The chart below was pulled directly from the Bureau of the Fiscal Service 2025 edition of the annual “Financial Report of the United States Government”.[1] Using the current path, today’s 99% net federal debt to GDP is projected to increase to 576% of GDP by 2100. Albert Gallatin’s statue is on the cover of this report. He was the Treasury secretary under Presidents Thomas Jefferson and James Madison and was a leading financial voice in Congress prior to becoming Secretary of the Treasury. He was widely cited for arguing consistently that governments must restrain spending, reduce debt, and align expenditures with revenues to avoid permanent deficits.

Interest expense as a percentage of federal receipts has now hit 20.6% year-to-date for 2026, a number that barely breached 10% for most of the last two decades. It is expected to continue to climb and becomes self-reinforcing as investors demand a higher yield for the risks of ballooning interest expenses, which further increases interest expenses due to that higher demanded yield. Paying interest expense is a non-GDP enhancing and society-improving use of capital.
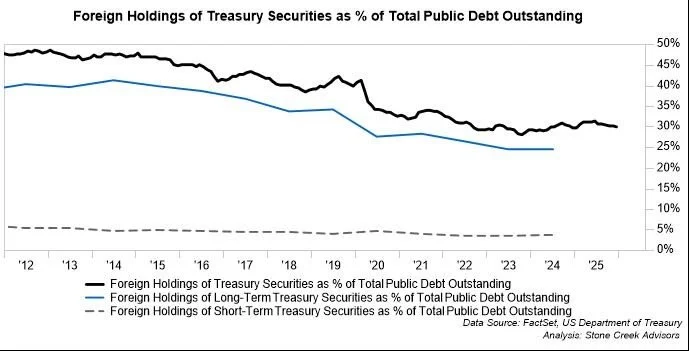
2. Foreigners own about 30% of US Treasuries. Most of their ownership is in longer-term Treasuries. In a world becoming more fractured and moving away from globalization this makes us very concerned.[2]
.
There are also factors such as the fact that at some point the Fed needs to begin shrinking its balance sheet. They have been a strong buyer of US Treasuries in the past, putting downward pressure on yields.
Today, inflation concerns are the other factor likely driving yields higher. Oil prices increasing due to the escalating conflict in Iran has driven oil prices above $100/barrel. Higher inflation makes it very difficult for the Fed to do its job, especially if growth continues to slow. This scenario, called stagflation, is particularly difficult for both companies and consumers to navigate.
Private Credit: Emerging Fault Lines
Private credit has been a significant beneficiary of the past decade, supported by low interest rates, abundant liquidity, and the retrenchment of traditional banks. It has grown rapidly, quietly, and with far less transparency than public markets.
The problem is not private credit itself, but rather the wrappers it was sold in and the marketing pitch that came with it. I’ve sat in numerous meetings over the past three years in which private credit managers consistently positioned the asset class as a way to smooth returns, reduce volatility, and enhance diversification.
These conversations have often followed a familiar pattern:
Me: What happens when liquidity gets pulled out of these fund?
Answer: We have a liquidity buffer and the interval structure allows for 5% redemptions each quarter, something we have never hit.
Me: I don’t believe the diversification and lower volatility story will hold up if markets go the other way and people try to run for the exits. Both of those characteristics are based on less frequent mark-to-market practices and a lack of true price discovery unless you are forced to sell.
Answer: General acknowledgment of the concern, often followed by references to strong performance in 2022.
Me: Because you weren’t forced to liquidate assets to meet redemptions. Valuations in your portfolios may not fully reflect underlying economic reality until assets are sold and prices are realized. These wrappers haven’t been around for a full cycle yet, we are monitoring them and their performance closely but would like to wait on the sidelines and see how these products hold up when liquidity is pulled out before allocating client capital.
To be fair, the 5% redemption cap per quarter was well disclosed. Most of these products were not sold directly to retail investors, they were pitched to Registered Investment Advisors (RIAs) that put part of their client’s assets in the funds. Furthermore, the illiquidity premium has historically provided enhanced returns relative to publicly traded alternatives. And the lower volatility and low return correlation has been true in an environment where capital continued to flow into them and the true value of the underlying holdings did not need to be realized.
However, higher rates are now colliding with capital structures built for a very different environment. Borrowers that once relied on cheap refinancing are facing materially higher costs of capital. At the same time, lenders, often operating with limited liquidity and infrequent price discovery, are forced to confront the reality that reported valuations diverge from realizable values. Unlike public markets, where stress is visible and repriced quickly, private credit stress tends to emerge slowly, then all at once.
A defining characteristic of private credit is its opacity, which can obscure underlying risks until they become difficult to manage. One indicator worth monitoring is the increasing share of loans utilizing payment-in-kind (PIK) structures, particularly those that were not originally structured as such (bad PIK). The PIK feature allows borrowers to defer cash interest payments during the life of the loan, effectively increasing leverage over time. According to data from Lincoln International[3], this was 5% of private loans at the beginning of 2022 but increased to 11% as of the end of 2025. Those “bad PIK” loans increased from 45% of PIK loans to 58.3% over the same period. While PIK can be used strategically, it can also be a sign of stress. According to a Bloomberg article written in February, Ron Kah, the global co-head of valuations and opinions at Lincoln said: “Companies we flagged as having bad PIK went from roughly 40/60 debt-to-equity, which is reasonable, to about 76% debt today—that’s a sign of stress.”[4]
As redemption requests increase, some of these funds have burned through their liquidity buffers. They are being forced to sell less liquid assets to meet redemption requests. And what are they selling? It is hard to say, but logic would be they are selling what they can get out of, which is likely the more liquid or higher quality loans. This dynamic may leave remaining investors increasingly exposed to less liquid or more challenged assets.
For certain investors with long time horizons, stable income needs, or institutional mandates, these structures were likely appropriate. However, when illiquid assets are housed within vehicles that offer periodic liquidity, it is critical to consider the composition and behavior of the broader investor base. Investors with shorter time horizons or lower tolerance for illiquidity may react differently under stress, potentially amplifying redemption pressures for all participants.
Capital flows into private credit have played an important role in supporting economic activity. Should this source of financing contract, it could have downstream effects on corporate investment and, by extension, economic growth. The lack of transparency makes it difficult to know whether this is just a liquidity issue due to the perceived risks within the loans or if the problem is the loans themselves. This may not remain contained.
The Impact of Higher Oil Prices on the US Economy
We historically have been a net importer of oil. Today we are a net exporter[5]. This means that the dynamic between oil prices, the dollar, and the US economy has changed.
For decades, when we were a net oil importer, higher oil prices were an unambiguous headwind for the U.S. economy. Rising energy costs acted as a direct tax on growth with a straightforward transmission mechanism. Higher oil meant less disposable income, weaker consumption, and increased pressure on margins. Historically when oil prices rose, the US (as a net importer) had to send more dollars abroad, worsening the trade deficit and putting downward pressure on the dollar. In the old world where we were energy dependent, oil shocks were uniformly negative.
Today, the US is now a net exporter of energy. On the surface, that should change the equation. Higher prices should benefit domestic producers, support investment, and provide a counterbalance to the traditional consumer drag. According to data from the U.S. Energy Information Administration (EIA), we are also much less dependent on energy in the US than we were during previous oil shocks. US energy consumption as a share of GDP has steadily fallen from around 12% through the 1970s to around 5% of GDP today. Meaning each dollar of output takes less oil than it used to.
However, the reality is more nuanced. Higher oil prices feed into inflation expectations in a way that is difficult for policymakers to ignore. Even if core measures remain stable, energy has a way of shaping perception. And perception often drives behavior. The U.S. is still a consumption-driven economy. Higher gasoline, heating, and transportation costs still function exactly as they always have, a tax on the consumer that crowds out discretionary spending. Higher oil prices tighten financial conditions without a single move from the Federal Reserve. Producers benefit, but consumers still suffer.
Higher oil prices now create a split outcome. Energy producers benefit. Capital flows into the sector. Investment increases. But that benefit is concentrated. The burden, however, is broad-based and immediate. It shows up in household budgets, in small business margins, and ultimately in consumption trends.
The first-order effect still looks like a tax, but the difference today lies in the second-order impacts. This creates an uneven transmission through the economy and puts the Fed in a difficult position. Do they look through energy-driven inflation, or do they respond to it?
The dollar is another factor to consider today. While historically higher oil prices have meant a weaker dollar, that relationship is less reliable today. Thus far higher oil prices have strengthened the dollar. All countries obviously do not share the same net exporter status and other countries are discussing hiking rates to offset the impact of higher energy prices. If they hike and the US does not, all else equal, the dollar should decline.
The Illusion of Breadth:
Passive Flows and Structural Distortions
Index concentration remains extremely elevated, even with the selloff in the first quarter. A handful of names did the heavy lifting over the past three years, while the median stock tells a very different story.
This creates three risks:
Perception risk: The index suggests broad strength that may not exist beneath the surface.
Valuation risk: When expectations are this high, even good news can disappoint.
Concentration risk: When the Technology sector comprises over 32% of the S&P 500, this sector will drive the index, especially when the next largest sector is only 12% of the index. According to data from JP Morgan, the Magnificent 7 drove 63% of returns in 2023, 55% in 2024, 46% in 2025, and have driven 83% of returns year-to-date in 2026.[6]
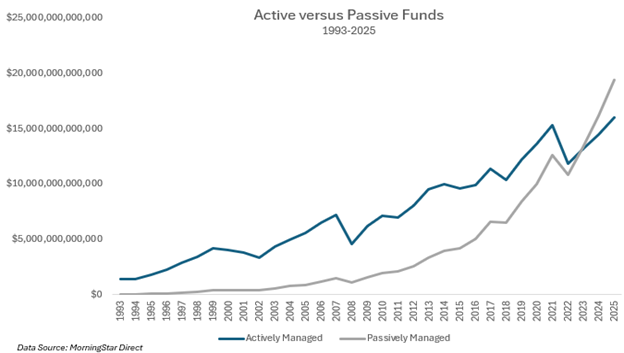
The continued migration toward passive investing is an important but underappreciated force shaping today’s markets. Passive funds surpassed active funds as a percentage of total assets in 2023, hitting 55% of assets in 2025. Capital is no longer being allocated based on fundamentals but based on index weight. The largest companies receive the most incremental capital, regardless of valuation. Smaller and less liquid securities are increasingly ignored. This impairs price discovery and makes markets less efficient.
John Bogle, the founder of Vanguard, is considered to be the pioneer of index investing. His famous quotes are widely cited, including:
“Don’t look for the needle in the haystack. Just buy the haystack.”
“Index funds eliminate the risks of individual stocks, market sectors, and manager selection. Only stock market risk remains.”
In the short term, this creates momentum. In the long term, it creates dislocation. And stock market risk definitely exists today.
There is certainly a place for passive management. While we are very active in our asset allocation, we do choose low-cost passive index funds where we just want to gain exposure and we do not think picking individual stocks will add alpha above having exposure to that factor, sector, or country.
However, in the broad index there is a major dislocation. Historically, buying the S&P 500 gave you exposure to 500 companies diversified across sectors, industries, and factors. Today, the flow towards passive has made the bigger companies bigger in terms of index weight and the smaller companies smaller. Companies are bought and sold indiscriminately based on if the investor likes or does not like the market. This has made for some wild swings.
Passive investing worked because it was diversified and there were active investors taking advantage of mispricing and guiding companies back towards fair value.
Today, we believe there are many stocks that are being mispriced based on their fundamentals. Some are very overvalued, and some are very undervalued. This dynamic has become more extreme over time and has stayed disconnected longer than it has historically. We believe the flow to passive has a lot to do with that. For active investors willing to do the work, these inefficiencies represent opportunity. But they also increase the potential for sharp reversals when flows change direction.
When narratives dislocate too far from reality, they tend to revert back to the mean. We are months past the most concentrated S&P 500 in history. The market is the most expensive it has ever been relative to GDP and it remains expensive relative to earnings.
A less cited quote from John Bogle:
“The most important of these rules is the first one: the eternal law of reversion to the mean (RTM) in the financial markets.”
The Narrowing Path
Markets, for now, appear comfortable with the current environment. Oil is viewed as a supply story. Growth is assumed to remain intact. Inflationary pressures are expected to be temporary, and policy is expected to remain supportive. The consumer is expected to hold up. AI is going to provide efficiency gains and a strong boost to corporate margins. There will be no meaningful credit event. That is still what is priced into the headline market in the US today. However, we think that path to perfection is narrowing and the margin for error is thin.
At the same time, gold continues to signal something different than equity markets. It is not pricing in a soft landing. It reflects concerns around currency debasement, fiscal sustainability, and geopolitical uncertainty. In many ways, gold is a vote of no confidence in the long-term trajectory of monetary and fiscal policy.
The United States continues to operate with historically large deficits outside of recession. Debt levels are rising and interest expense is growing. The path to fiscal discipline remains unclear. Confidence fades gradually, not overnight. For now, the dollar remains relatively strong, but reserve currency status is not immune to long-term erosion. While we are not making a near-term call on the dollar, we are increasingly aware the foundation is not as solid as it was.
With immigration slowing to a halt and labor force growth slowing to near stand-still, productivity needs to pick up in a meaningful way to keep GDP growth strong.
Collectively these stresses could start to matter. This is how slowdowns typically develop. Not from a single shock, but from the cumulative weight of multiple small pressures that gradually reduce the system’s ability to absorb stress.
Positioning: Endure First, Then Perform
Our approach remains unchanged. We are preparing for more volatility by maintaining a focus on downside protection, actively allocating capital where risk and reward are asymmetric, avoiding areas where valuations require perfection, and holding dry powder to capitalize on volatility when it arrives.
In an environment shaped by passive flows, concentrated leadership, and hidden leverage, it is essential to be flexible.
Optimism is high. Risks are acknowledged, but discounted and liquidity is assumed to be available when needed. Markets have a way of reminding investors that assumptions are not guarantees. For now, people seem to have forgotten that markets don’t always go up.
The goal is not simply to perform when conditions are ideal, but to endure when they are not. Preserving capital during tough periods allows for deployment of capital as opportunities emerge.
As always, please reach out with any questions.
Kasey
[1]https://fiscal.treasury.gov/system/files/2026-03/FY-2025-Financial-Report-3-19-2025%28Final%29.pdf
[2]https://www.stonecreek-advisors.com/blog/deglobalization-and-investing
[3]Global Investment Bank - Lincoln International LLC
[4]‘Bad PIK’ Is Climbing Again as Private Lenders Scrutinize Books - Bloomberg
[5]Is the US a bigger oil importer or exporter? | USAFacts
[6]Guide to the Markets | J.P. Morgan Asset Management Slide 9
Stone Creek Advisors is a DBA of OneSeven, an investment adviser in Ohio. OneSeven is registered with the Securities and Exchange Commission ("SEC"). Registration of an investment adviser does not imply any specific level of skill or training and does not constitute an endorsement of the firm by the Commission. OneSeven only transacts business in states in which it is properly registered or is excluded or exempted from registration. A copy of OneSeven's current written disclosure brochure filed with the SEC, which discusses OneSeven's business practices, services, and fees, is available through the SEC's website at: www.adviserinfo.sec.gov. All titles listed for Individuals associated with Stone Creek Advisors represent the individual's role with Stone Creek Advisors.
Please note, the information provided in this presentation is for informational purposes only and investors should determine for themselves whether a particular service or product is suitable for their investment needs. Please refer to the disclosure and offering documents for further information concerning specific products or services. Investments in securities entail risk and are not suitable for all investors. Past performance is not a guarantee of future returns. This is not a recommendation nor an offer to sell (or solicitation of an offer to buy) securities in the United States or in any other jurisdiction.